Service spotlight
LinkedIn shares prices, week to 27 October 2026
Data 21–27 October 20264 min readThe PanelCompare editorial team
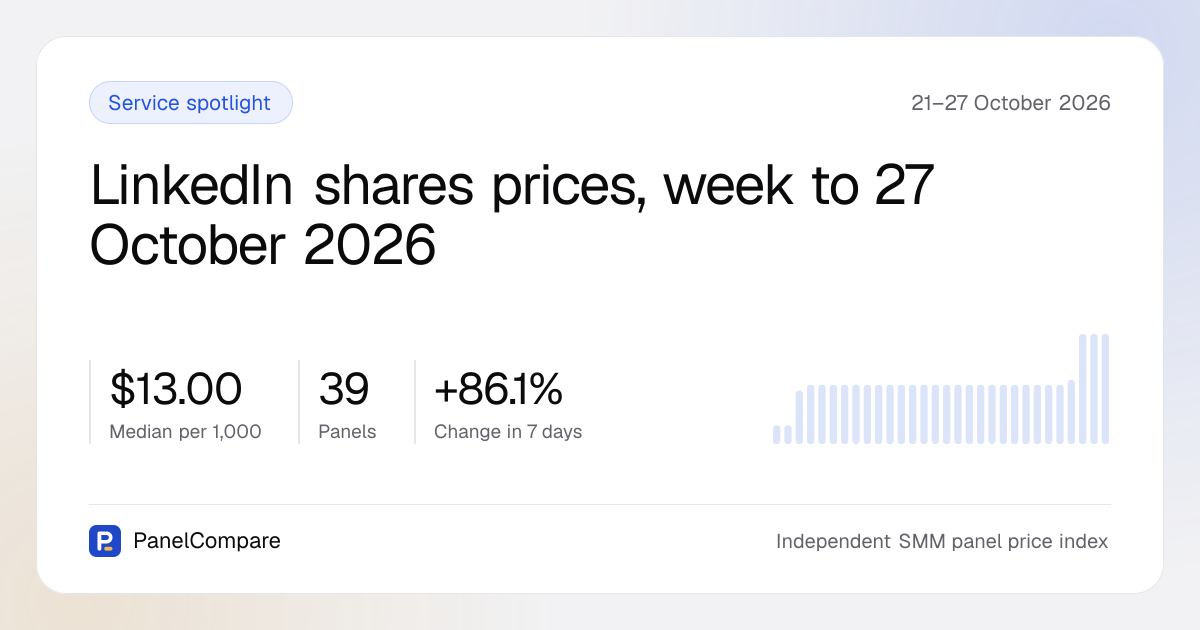
The median price today and the change over the week
PanelCompare's index for LinkedIn Shares / Reposts on 26 October 2026 puts the median at $13.00 per 1,000 shares, across 39 panels. The lower quartile was $0.972 and the upper quartile $48.62, so the middle half of offers covers a very wide range. Prices are in US dollars per 1,000 units, and one unit is one share.
On 19 October 2026 the median was $6.99, and the change from 19 October 2026 to 26 October 2026 was +86.1%. This post covers 21 October 2026 to 27 October 2026; the latest index day is 26 October 2026.
The index counts distinct panels, not catalogue rows, and uses medians and quartiles rather than the single cheapest row, because the cheapest rows are often category headers, package rows or a different service filed under the same name. Every panel's price is on the LinkedIn Shares / Reposts price page.
The median over 30 days
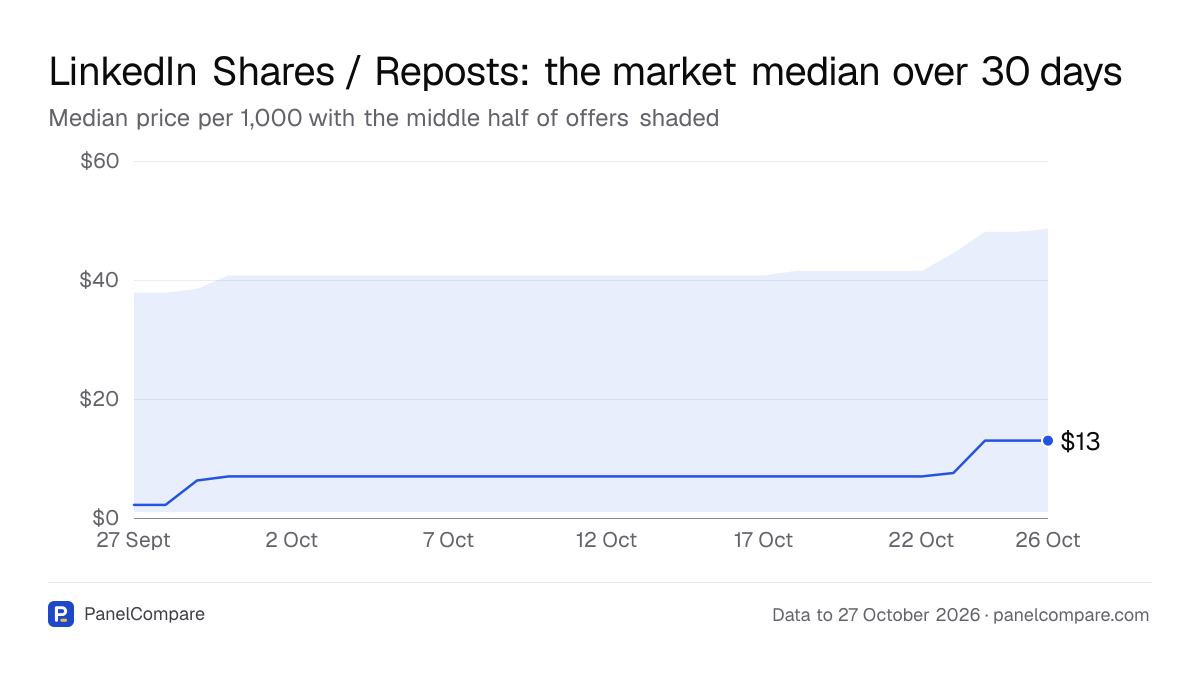
The 30-day series has 30 index days. It starts on 27 September 2026 at a median of $2.20, the lowest in the series, and ends on 26 October 2026 at $13.00, a change of +491%. The highest median, $13.00, was first reached on 24 October 2026 and held on 25 and 26 October 2026.
The path came in steps rather than a steady climb. The median moved to $6.30 on 29 September 2026 and $6.99 on 30 September 2026, then stayed at $6.99 every day until 22 October 2026. It rose to $7.56 on 23 October 2026 and $13.00 on 24 October 2026.
The number of panels in the index row rose over the same days, from 33 on 22 October 2026 to 35 on 23 October 2026, 38 on 24 October 2026 and 39 on 26 October 2026. The upper quartile climbed from $37.91 on 27 September 2026 to $48.62 on 26 October 2026, while the lower quartile stayed at $0.972 on every day of the series.
The figures in this chart
| Day | Median | Lower quartile | Upper quartile |
|---|---|---|---|
| 27 Sept | $2.20 | $0.972 | $37.91 |
| 28 Sept | $2.20 | $0.972 | $37.91 |
| 29 Sept | $6.30 | $0.972 | $38.50 |
| 30 Sept | $6.99 | $0.972 | $40.79 |
| 1 Oct | $6.99 | $0.972 | $40.79 |
| 2 Oct | $6.99 | $0.972 | $40.79 |
| 3 Oct | $6.99 | $0.972 | $40.79 |
| 4 Oct | $6.99 | $0.972 | $40.79 |
| 5 Oct | $6.99 | $0.972 | $40.79 |
| 6 Oct | $6.99 | $0.972 | $40.79 |
| 7 Oct | $6.99 | $0.972 | $40.79 |
| 8 Oct | $6.99 | $0.972 | $40.79 |
| 9 Oct | $6.99 | $0.972 | $40.79 |
| 10 Oct | $6.99 | $0.972 | $40.79 |
| 11 Oct | $6.99 | $0.972 | $40.79 |
| 12 Oct | $6.99 | $0.972 | $40.79 |
| 13 Oct | $6.99 | $0.972 | $40.79 |
| 14 Oct | $6.99 | $0.972 | $40.79 |
| 15 Oct | $6.99 | $0.972 | $40.79 |
| 16 Oct | $6.99 | $0.972 | $40.79 |
| 17 Oct | $6.99 | $0.972 | $40.79 |
| 18 Oct | $6.99 | $0.972 | $41.53 |
| 19 Oct | $6.99 | $0.972 | $41.53 |
| 20 Oct | $6.99 | $0.972 | $41.53 |
| 21 Oct | $6.99 | $0.972 | $41.53 |
| 22 Oct | $6.99 | $0.972 | $41.53 |
| 23 Oct | $7.56 | $0.972 | $44.54 |
| 24 Oct | $13.00 | $0.972 | $48.09 |
| 25 Oct | $13.00 | $0.972 | $48.09 |
| 26 Oct | $13.00 | $0.972 | $48.62 |
Where today's offers are priced
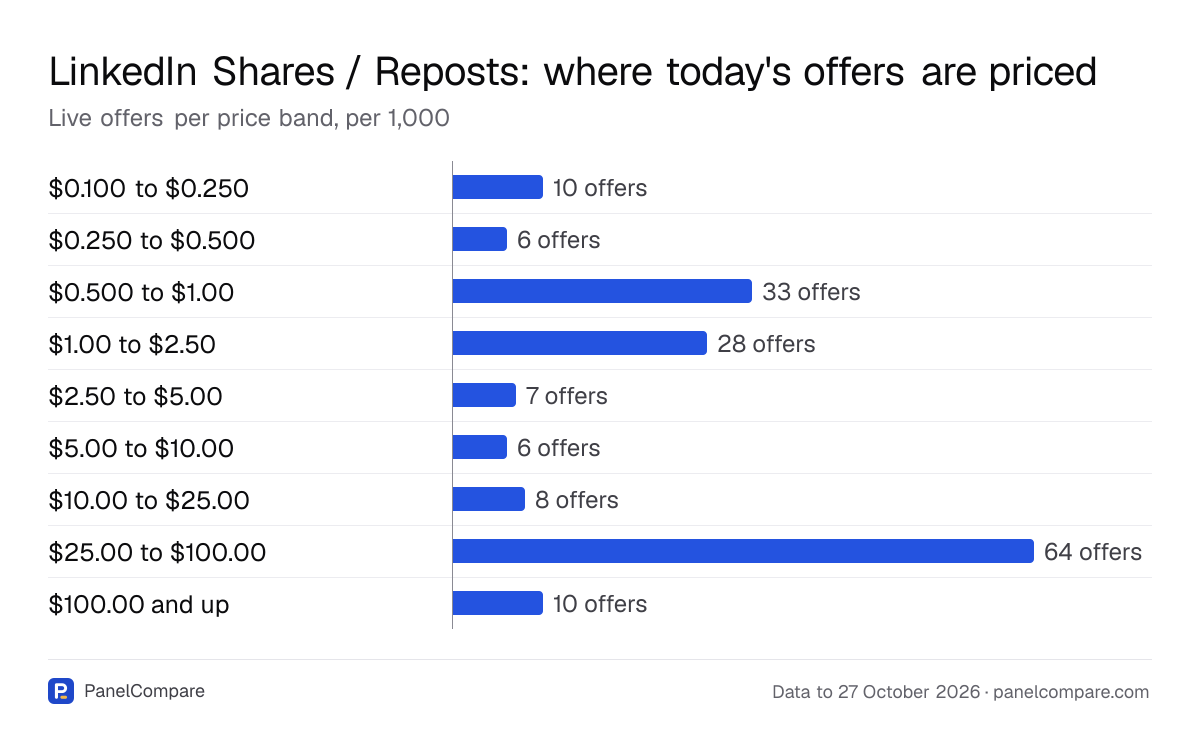
On 26 October 2026, 172 live offers were listed by 39 panels, with flagged and offline panels excluded. How prices are read is set out in the methodology. The offers fall into two clusters rather than one even spread.
At the cheap end, 33 offers sit between $0.500 and $1.00 and 28 between $1.00 and $2.50, with 10 between $0.100 and $0.250 and 6 between $0.250 and $0.500. At the expensive end, 64 offers sit between $25.00 and $100.00, the largest single band, and 10 cost $100.00 or more.
The middle bands are thin: 7 offers from $2.50 to $5.00, 6 from $5.00 to $10.00 and 8 from $10.00 to $25.00. With so few offers in the middle, a small change in the mix of listed offers can move the median a long way, which matches the steps seen in the series.
The figures in this chart
| Value | |
|---|---|
| $0.100 to $0.250 | 10 offers |
| $0.250 to $0.500 | 6 offers |
| $0.500 to $1.00 | 33 offers |
| $1.00 to $2.50 | 28 offers |
| $2.50 to $5.00 | 7 offers |
| $5.00 to $10.00 | 6 offers |
| $10.00 to $25.00 | 8 offers |
| $25.00 to $100.00 | 64 offers |
| $100.00 and up | 10 offers |
Worldwide and geo-targeted offers
Of the 172 live offers on 26 October 2026, 128 are delivered worldwide with no geo target and 44 are targeted to a country or region. The worldwide median was $30.40 per 1,000 shares and the geo-targeted median $1.62.
Geo-targeted offers are a different product from worldwide ones, which is why the two medians are given separately. Targeted offers usually cost more, but on this service on 26 October 2026 the geo-targeted median was well below the worldwide one. Compare any offer with others of the same kind rather than with the overall median.
Price cuts, rises and new offerings this week
Between 21 October 2026 and 27 October 2026, PanelCompare recorded 9 price cuts and 0 price rises on this service. A move is recorded when the same catalogue row changes by 2% or more between two reads. In the same window 15 offerings were added and 1 was removed; the moves are listed on the LinkedIn price changes page.
With no recorded rises, the higher median this week did not come from panels raising existing prices. It came with the change in which offers are listed.
SocNet SMM cut its row named “LinkedIn Post shares” from $25.50 to $22.50, a change of −11.8%, recorded on 26 October 2026. The row sits on the SocNet SMM price list.
SmmBind cut a row from $0.155 to $0.150, a change of −3.3%, also recorded on 26 October 2026. The panel's own row name begins “YouTube Social Shares from Linkedin [Refill: Lifetime]”, so check on the SmmBind price list what it delivers before treating it as a LinkedIn repost.
How to read an offer before buying
The spread on this service is wide enough that a price alone says little about what you are buying. A short routine before ordering:
- Read the panel's own row name, not just the category, and check that it says LinkedIn shares or reposts.
- Note whether the row names a country or region, then compare worldwide offers with the worldwide median of $30.40 and geo-targeted offers with $1.62, not with the overall $13.00.
- Treat rows at the very bottom of the list with care, since cheap rows are often headers, packages or another service under the same name.
- Check the refill terms in the row name, such as SmmBind's “[Refill: Lifetime]”.
- Look at the panel's recent price moves before assuming a price will hold.
How this post was made
Our code read the PanelCompare database for 21–27 October 2026 and built a fact sheet of 30 figures and 3 tables. An AI model (Claude) drafted the text from that sheet alone, and code checked that every number in it appears on the sheet before it was published. The charts are drawn from the same figures, not written by hand.
- Medians and quartiles are used rather than the single cheapest row, because the cheapest rows in a catalogue are often category headers, package rows or a different service filed under the same name.
- Geo-targeted offers (a country or region) are a different product from worldwide ones and usually cost more; the two medians are given separately for that reason.
- The index counts distinct panels, not rows.