How to read the data
Reading an SMM price spread: Instagram Followers on 29 October 2026
Data 23–29 October 20264 min readThe PanelCompare editorial team
The figures at the top of a service page
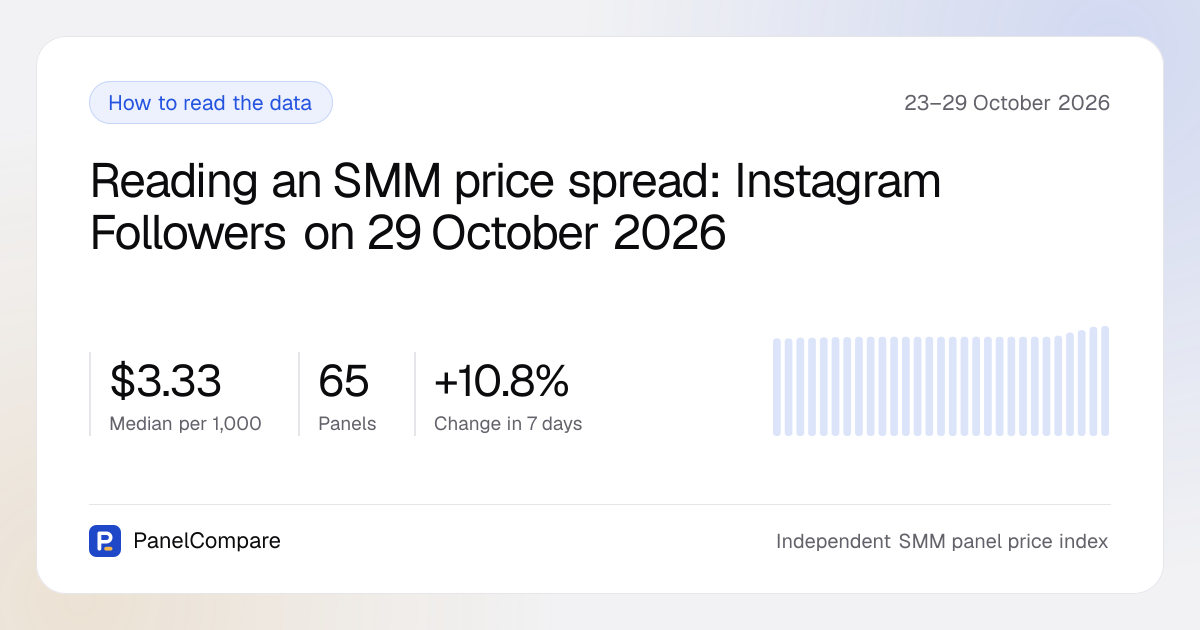
Every price on PanelCompare is in US dollars per 1,000 units. For Instagram Followers the unit is followers. The figures below are from the index day of 29 October 2026.
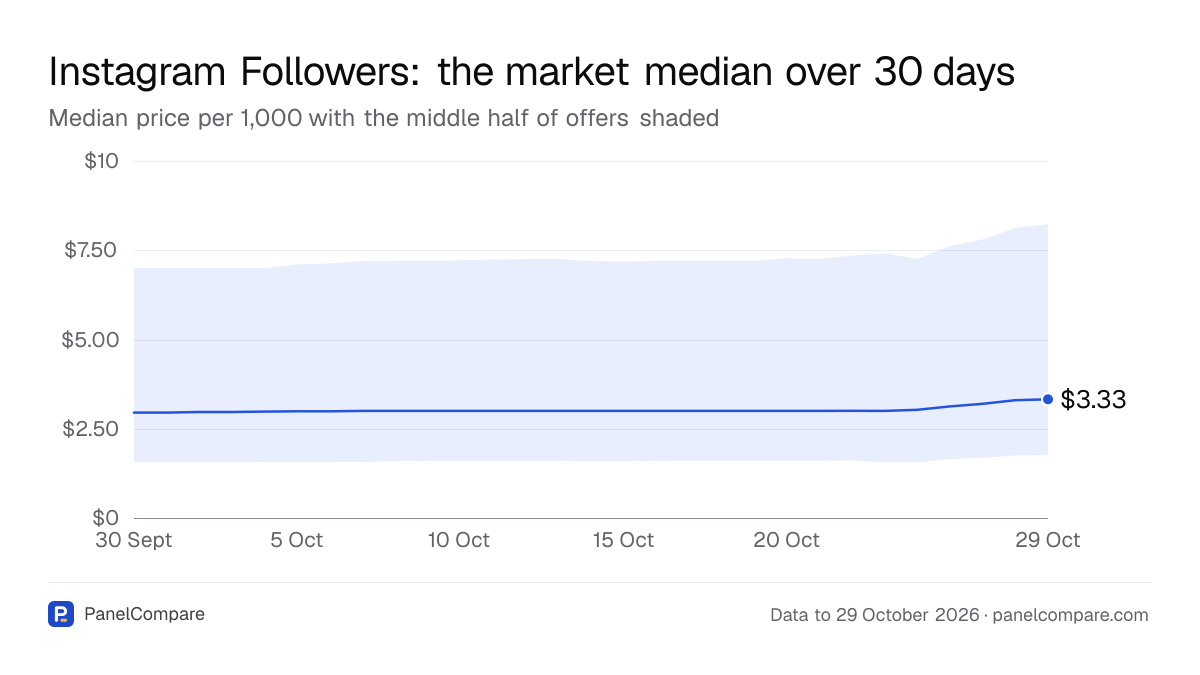
The median is the middle price: half of the offers cost less and half cost more. For Instagram Followers on 29 October 2026 it was $3.33 per 1,000. You can check it against every panel's row on the Instagram Followers service page.
The lower quartile is the price that a quarter of offers cost or less. On 29 October 2026 it was $1.76 per 1,000, and offers below it form the cheap end of the market.
The upper quartile is the price where the dearest quarter of offers begins. On 29 October 2026 it was $8.23 per 1,000. The middle half of all offers sits between the 2 quartiles, so this gap shows how wide the ordinary market is.
The panel count is the number of distinct panels in the index row. It was 65 on 29 October 2026. It counts panels, not rows, so a panel with many follower services counts once. Those 65 panels listed 19,260 live offers that day, with flagged and offline panels excluded.
Where today's offers sit across price bands
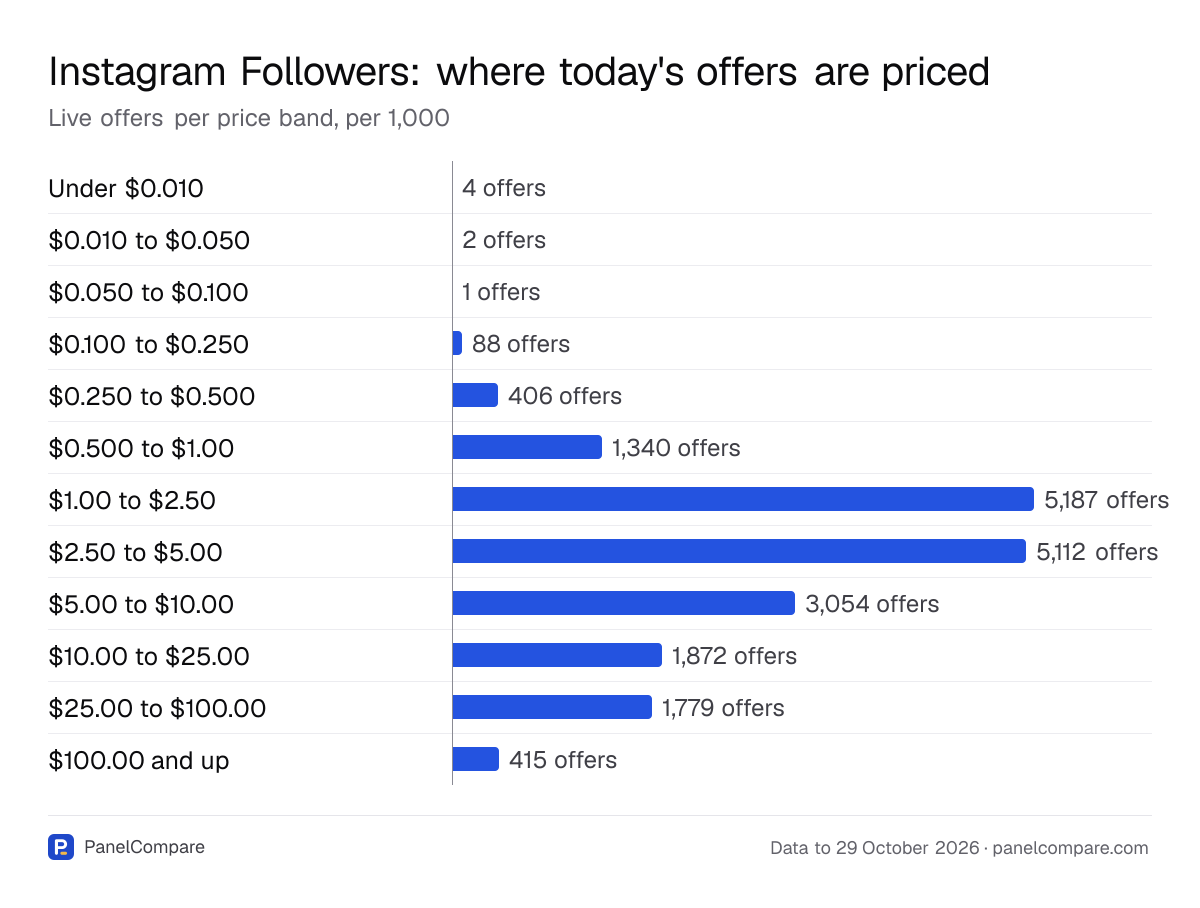
The price bands count live offers in each price range. The busiest bands are $1.00 to $2.50, with 5,187 offers, and $2.50 to $5.00, with 5,112 offers. The median of $3.33 falls inside the second of those.
The tails are long in both directions. At the top, 1,779 offers sit between $25.00 and $100.00, and 415 cost $100.00 and up. At the bottom, 4 offers are under $0.010, 2 are between $0.010 and $0.050, and 1 is between $0.050 and $0.100.
This is why the cheapest single row is not the market price. The cheapest rows in a catalogue are often category headers, package rows or a different service filed under the same name. PanelCompare uses medians and quartiles for that reason, and the methodology page explains how rows are collected.
Single rows also move sharply. SMM Panel King's row "Instagram Followers | High Quality | Less Drop | No Refill" went from $2.76 to $0.970 on 25 October 2026, recorded as −64.9%. The row name itself says "No Refill", and that matters when you compare its price with the spread.
The figures in this chart
| Value | |
|---|---|
| Under $0.010 | 4 offers |
| $0.010 to $0.050 | 2 offers |
| $0.050 to $0.100 | 1 offers |
| $0.100 to $0.250 | 88 offers |
| $0.250 to $0.500 | 406 offers |
| $0.500 to $1.00 | 1,340 offers |
| $1.00 to $2.50 | 5,187 offers |
| $2.50 to $5.00 | 5,112 offers |
| $5.00 to $10.00 | 3,054 offers |
| $10.00 to $25.00 | 1,872 offers |
| $25.00 to $100.00 | 1,779 offers |
| $100.00 and up | 415 offers |
Why geo-targeted offers are compared separately
Offers targeted to a country or region are a different product from worldwide ones and usually cost more, so PanelCompare gives them separate medians. On 29 October 2026 there were 13,438 worldwide offers with a median of $2.65 per 1,000. There were also 5,822 geo-targeted offers with a median of $8.78.
The all-offer median of $3.33 sits between those 2 figures. If you sell worldwide followers, compare against $2.65. If you sell a country-targeted product, compare against $8.78.
The largest rise in the window shows why the split matters. ApiSMM's row "Instagram Followers 🇹🇷 [ Max 10K ] | [ Turkey ] [ Old Accounts ] | 30 Days Refill ♻️" went from $0.936 to $9.41 on 29 October 2026, recorded as +906%. The name says "[ Turkey ]" and "30 Days Refill", so it belongs with targeted offers. Its full price list shows the rest of its catalogue.
How the median moved over 30 days
The series has 29 index days, from 30 September 2026 to 29 October 2026. The median was $2.95 on the first day, the lowest in the series. It was $3.33 on the last day, the highest, a change of +12.7%.
Most of that move came late. The median held at $3.00 from 7 October to 23 October 2026, then rose on each index day to $3.33 on 29 October 2026. Measured from $3.00 on 22 October 2026, the change is +10.8%.
Over the same late stretch, the panel count went from 58 on 22 October 2026 to 65 on 26 October 2026. The upper quartile also rose, from $7.35 on 22 October to $8.23 on 29 October 2026. The data shows these moves but not why they happened.
Individual rows moved in both directions. Between 23 and 29 October 2026, PanelCompare recorded 1,023 price rises and 1,366 price cuts on this service, counting only changes of 2% or more between 2 reads of the same row. In the same window, 2,098 offerings were added and 760 were removed. The median reflects the whole mix of offers, including additions and removals, so cuts can outnumber rises while the median still goes up. The Instagram price changes page lists every move.
The figures in this chart
| Day | Median | Lower quartile | Upper quartile |
|---|---|---|---|
| 30 Sept | $2.95 | $1.56 | $7.00 |
| 1 Oct | $2.95 | $1.56 | $7.00 |
| 2 Oct | $2.97 | $1.56 | $7.00 |
| 3 Oct | $2.97 | $1.56 | $7.00 |
| 4 Oct | $2.98 | $1.57 | $7.00 |
| 5 Oct | $2.99 | $1.57 | $7.10 |
| 6 Oct | $2.99 | $1.57 | $7.13 |
| 7 Oct | $3.00 | $1.57 | $7.20 |
| 8 Oct | $3.00 | $1.59 | $7.20 |
| 9 Oct | $3.00 | $1.60 | $7.20 |
| 10 Oct | $3.00 | $1.60 | $7.22 |
| 11 Oct | $3.00 | $1.60 | $7.24 |
| 12 Oct | $3.00 | $1.60 | $7.25 |
| 13 Oct | $3.00 | $1.60 | $7.25 |
| 14 Oct | $3.00 | $1.58 | $7.20 |
| 15 Oct | $3.00 | $1.59 | $7.19 |
| 16 Oct | $3.00 | $1.60 | $7.20 |
| 17 Oct | $3.00 | $1.60 | $7.20 |
| 18 Oct | $3.00 | $1.60 | $7.21 |
| 19 Oct | $3.00 | $1.60 | $7.20 |
| 20 Oct | $3.00 | $1.60 | $7.27 |
| 21 Oct | $3.00 | $1.60 | $7.26 |
| 22 Oct | $3.00 | $1.61 | $7.35 |
| 23 Oct | $3.00 | $1.55 | $7.41 |
| 24 Oct | $3.03 | $1.56 | $7.26 |
| 25 Oct | $3.13 | $1.65 | $7.62 |
| 26 Oct | $3.20 | $1.69 | $7.80 |
| 28 Oct | $3.30 | $1.75 | $8.13 |
| 29 Oct | $3.33 | $1.76 | $8.23 |
A routine for any service page
The same reading works on every page of the daily price index. Before quoting a price to a client:
- Read the median and both quartiles together, and note the panel count and the index date, rather than starting from the cheapest row.
- Check whether your product is worldwide or geo-targeted, and compare it against the matching median.
- Open the price list of any panel you plan to use, and read its own row name for country, refill period and quality tier before comparing its price with the spread.
How this post was made
Our code read the PanelCompare database for 23–29 October 2026 and built a fact sheet of 30 figures and 4 tables. An AI model (Claude) drafted the text from that sheet alone, and code checked that every number in it appears on the sheet before it was published. The charts are drawn from the same figures, not written by hand.
- Medians and quartiles are used rather than the single cheapest row, because the cheapest rows in a catalogue are often category headers, package rows or a different service filed under the same name.
- Geo-targeted offers (a country or region) are a different product from worldwide ones and usually cost more; the two medians are given separately for that reason.
- The index counts distinct panels, not rows.