Skip to content

SMM panel market notes, from the data

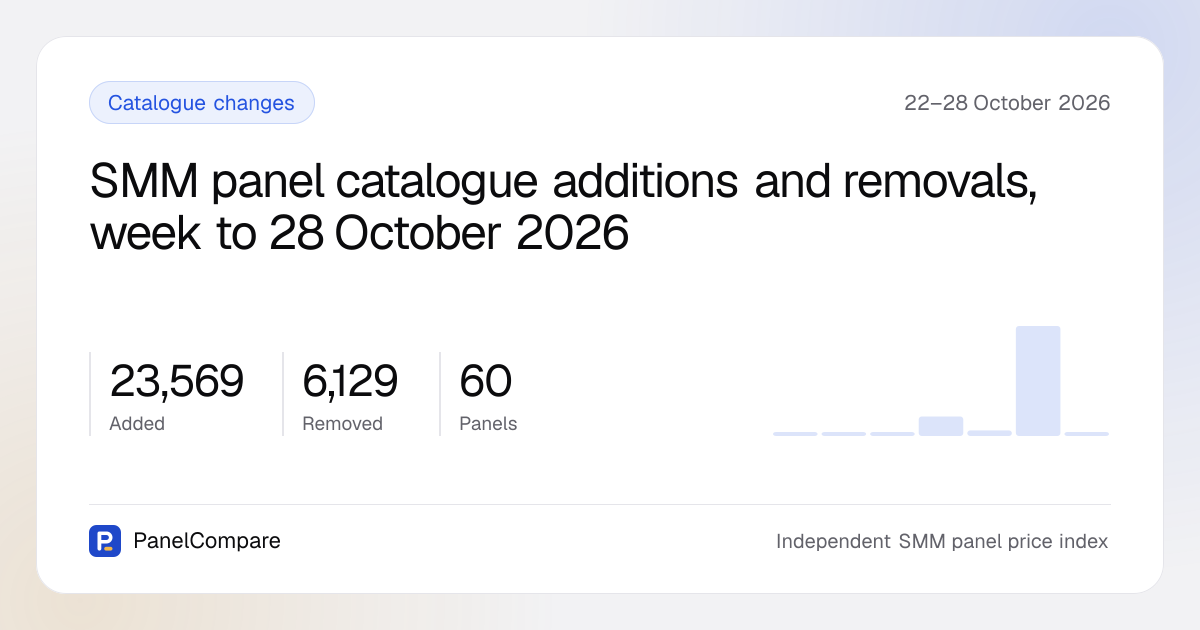
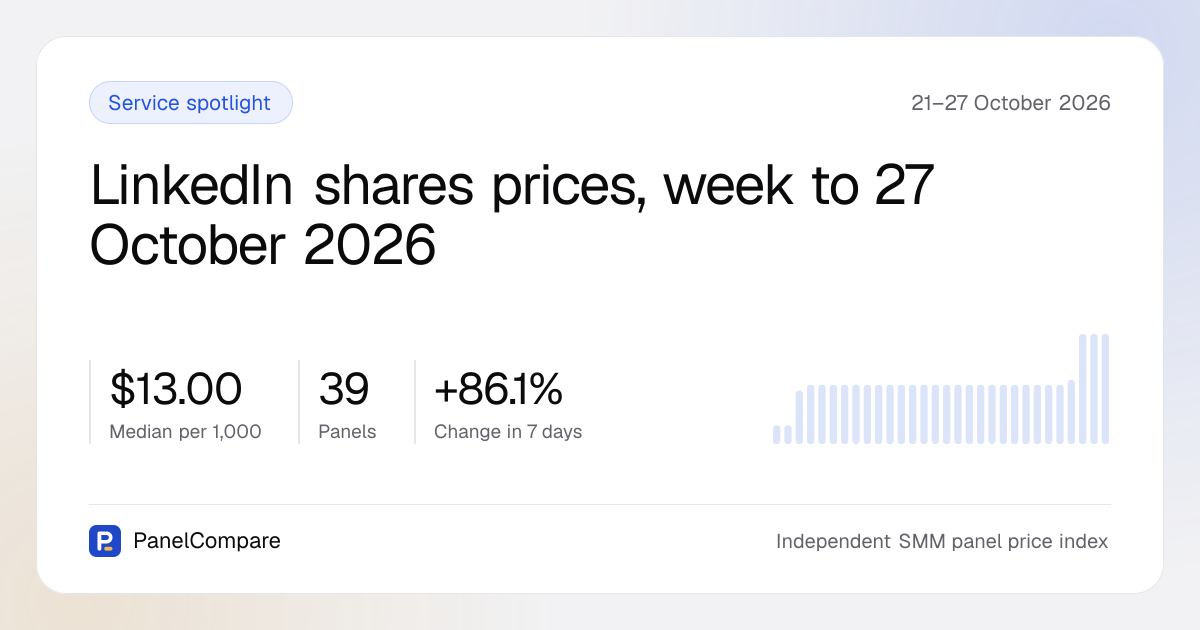
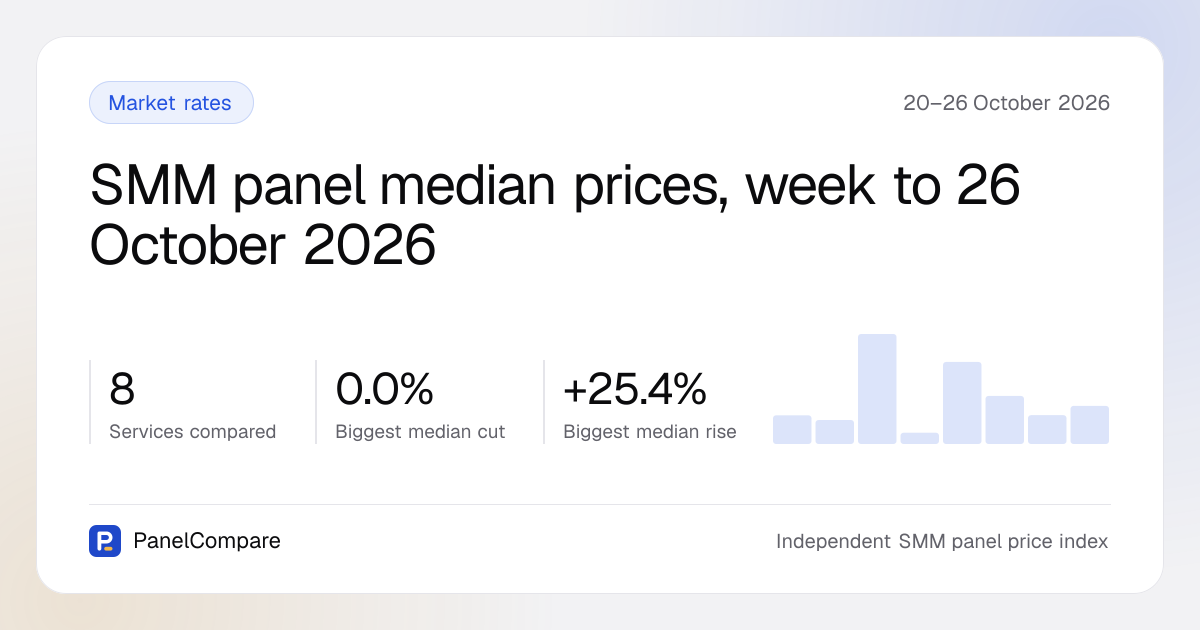
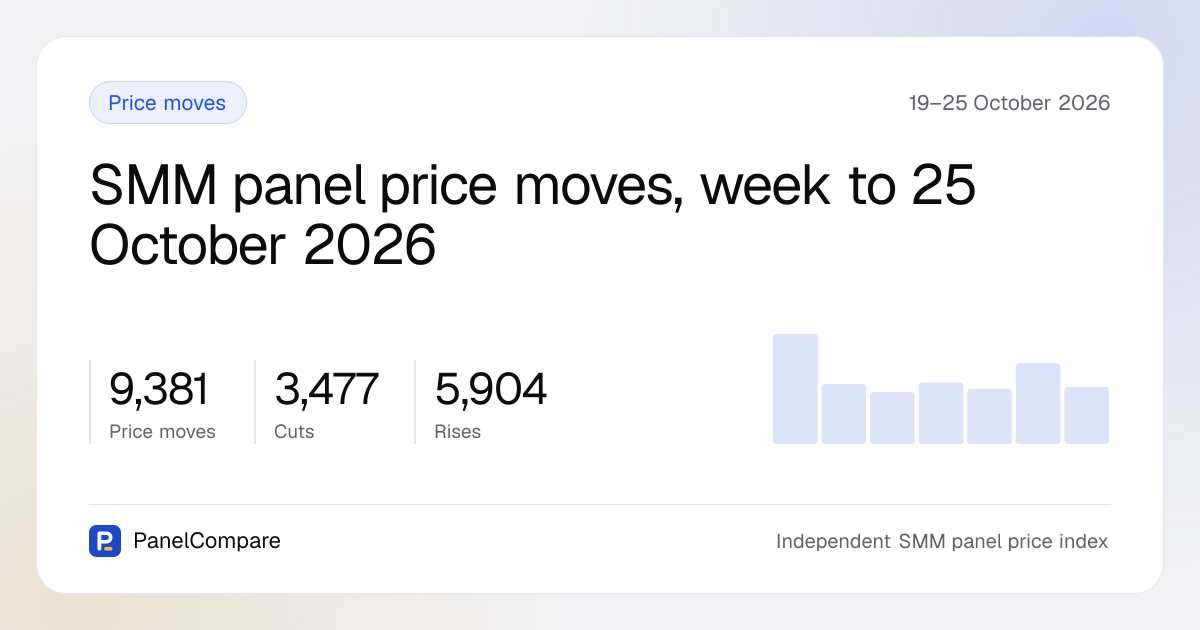
One post a day on what the index recorded: which prices moved, where the typical rate sits on the most-traded services, what panels added to and dropped from their catalogues, and which storefronts stopped answering. Each post is written from a fact sheet our code builds from the database, and every figure in it links to the page where you can check it.

Earlier posts

How these posts are made

Each morning a job reads the previous seven days from the PanelCompare database — catalogue changes, the daily price index, uptime probes — and assembles a fact sheet. An AI model (Claude) drafts the post from that sheet alone; before anything is published, code checks that every number in the text appears on the sheet, and the post is dropped if it does not. The charts are drawn from the same figures. When a week has nothing worth saying, no post goes out. The method behind the numbers is on the methodology page.