Market rates
SMM panel median prices, week to 26 October 2026
Data 20–26 October 20264 min readThe PanelCompare editorial team
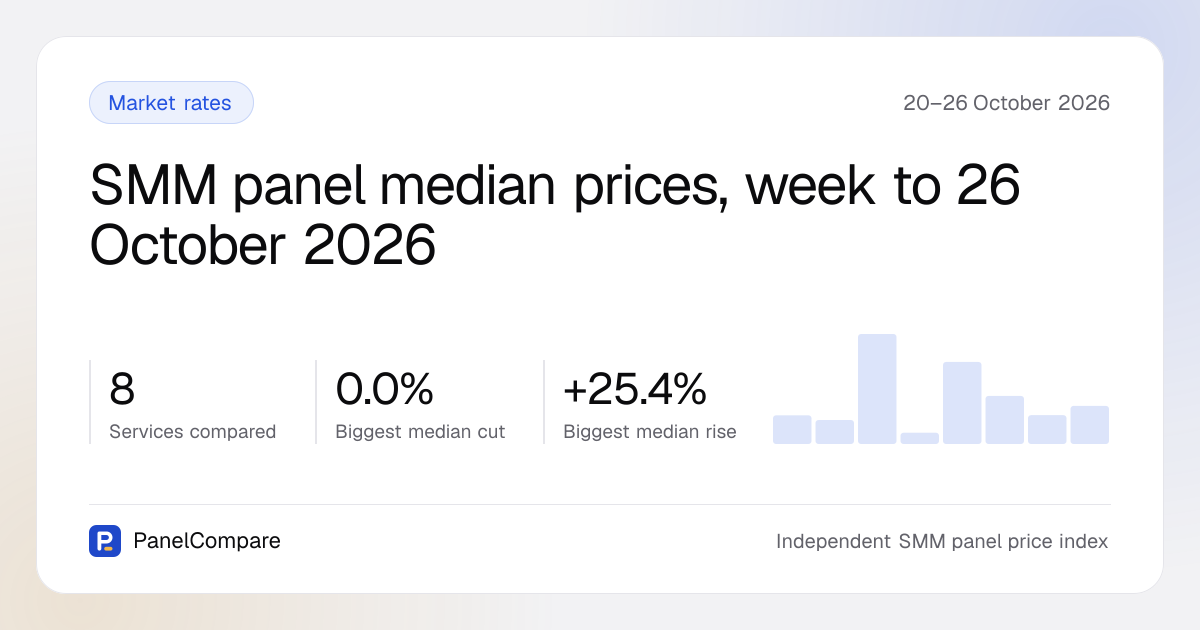
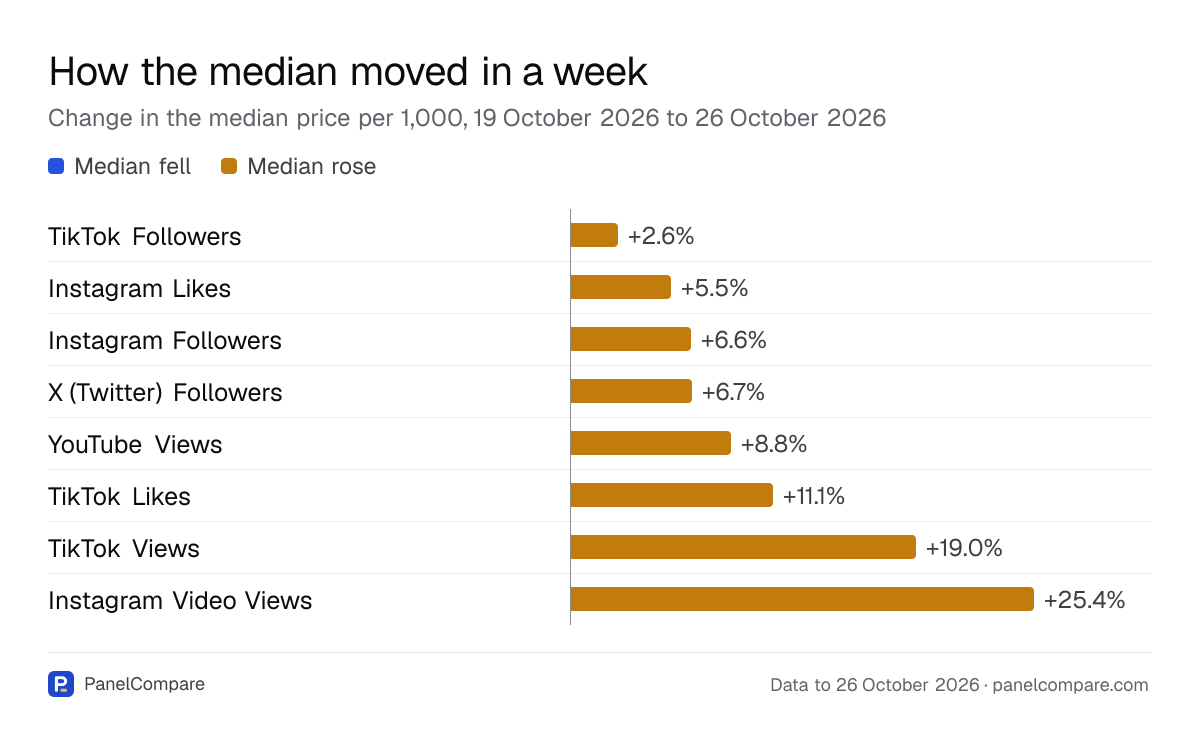
Every median rose between 19 and 26 October 2026
PanelCompare compares 8 most-traded services. These are services with high search demand and at least 10 panels in the index. On 26 October 2026, the median price per 1,000 was higher than on 19 October 2026 for all of them.
Views moved most. Instagram Video Views rose from $0.011 to $0.014 (+25.4%), and TikTok Views rose from $0.058 to $0.069 (+19.0%). TikTok Likes came next, going from $0.363 to $0.403 (+11.1%).
The rest moved less. The YouTube Views median changed by +8.8%, X (Twitter) Followers by +6.7%, Instagram Followers by +6.6% and Instagram Likes by +5.5%. TikTok Followers moved least, from $2.34 to $2.40 (+2.6%).
Both of the leading view services are priced in fractions of a cent per 1,000. A small shift in the middle offer therefore shows up as a large percentage. The data does not show why any median moved, and this post does not guess. Every daily figure is on the daily price index.
The figures in this chart
| Value | |
|---|---|
| TikTok Followers | +2.6% |
| Instagram Likes | +5.5% |
| Instagram Followers | +6.6% |
| X (Twitter) Followers | +6.7% |
| YouTube Views | +8.8% |
| TikTok Likes | +11.1% |
| TikTok Views | +19.0% |
| Instagram Video Views | +25.4% |
Why the post uses the median and quartiles, not the cheapest row
The cheapest rows in a catalogue are often not real offers for the service in question. They can be category headers, package rows or a different service filed under the same name. A lowest-price figure would often describe something other than the service.
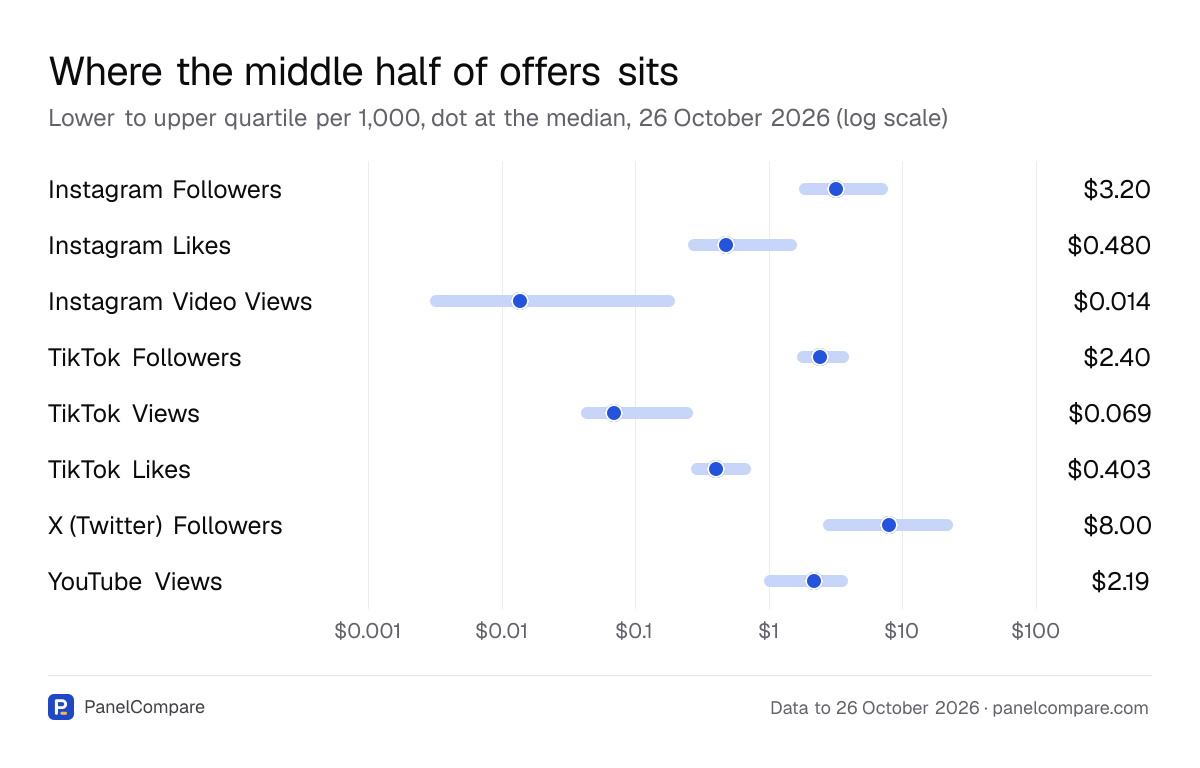
The median is the middle offer, with as many panels priced above it as below. A quarter of offers cost the lower quartile or less, and only the dearest quarter cost more than the upper quartile. The range between the quartiles is where typical offers sit.
The index counts distinct panels, not rows. A panel listing many variants of a service counts once, so the 60 to 65 panels behind each service are separate shops. A change between 2 reads of the same catalogue row is recorded as a price move only if it is at least 2%, as set out in the methodology.
The figures in this chart
| Service | Lower quartile | Median | Upper quartile |
|---|---|---|---|
| Instagram Followers | $1.69 | $3.20 | $7.80 |
| Instagram Likes | $0.250 | $0.480 | $1.61 |
| Instagram Video Views | $0.0029 | $0.014 | $0.200 |
| TikTok Followers | $1.63 | $2.40 | $4.00 |
| TikTok Views | $0.039 | $0.069 | $0.270 |
| TikTok Likes | $0.261 | $0.403 | $0.740 |
| X (Twitter) Followers | $2.54 | $8.00 | $23.82 |
| YouTube Views | $0.927 | $2.19 | $3.94 |
Instagram prices on 26 October 2026
Instagram Followers had a median of $3.20 across 65 panels on 26 October 2026. The lower quartile was $1.69 and the upper quartile $7.80. The full list is on the Instagram Followers price page.
Instagram Likes had a median of $0.480 across 64 panels. Its lower quartile was $0.250 and its upper quartile $1.61. Each panel's row is on the Instagram Likes price page.
Instagram Video Views had the lowest median of the 8 services, at $0.014 across 64 panels. It also had the widest spread relative to its price, with a lower quartile of $0.0029 and an upper quartile of $0.200. Row names explain much of that spread, so check them on the Instagram Video Views price page.
TikTok prices on 26 October 2026
TikTok Followers had the narrowest middle range of the 3 follower services. The median was $2.40 across 64 panels, with quartiles of $1.63 and $4.00. Its median sat below the $3.20 for Instagram Followers. Every offer is on the TikTok Followers price page.
TikTok Views had a median of $0.069 across 64 panels, a lower quartile of $0.039 and an upper quartile of $0.270. Its typical price is well above Instagram Video Views. The rows are on the TikTok Views price page.
TikTok Likes had a median of $0.403 across 63 panels, with quartiles of $0.261 and $0.740. That median is below the $0.480 for Instagram Likes. Its upper quartile is also much lower than the $1.61 for Instagram Likes. See the TikTok Likes price page.
X (Twitter) Followers and YouTube Views
X (Twitter) Followers had the highest median of the 8 services on 26 October 2026, at $8.00 across 61 panels. It also had the widest range in dollar terms, from a lower quartile of $2.54 to an upper quartile of $23.82. With a range that wide, the row name matters more than usual. Compare offers on the X (Twitter) Followers price page.
YouTube Views had a median of $2.19 across 60 panels, with quartiles of $0.927 and $3.94. Its typical price is far above the views services on Instagram and TikTok. The panel-by-panel list is on the YouTube Views price page.
How to use the quartiles when checking a price
The quartiles give you a quick test for any row in a panel's catalogue. Use the 26 October 2026 figures above, or the current figures on each service page, and see where the row's price falls.
A short routine for each price you check:
- Below the lower quartile: read the row name closely before ordering. Make sure it is the same service and not a package row, a header or a different service under the same name.
- Between the quartiles: the price is in the typical range for that service.
- Above the upper quartile: the row is either paying for something specific, such as a geo target, a refill period or speed, or you are overpaying. The row name should show which.
How this post was made
Our code read the PanelCompare database for 20–26 October 2026 and built a fact sheet of 56 figures and 1 tables. An AI model (Claude) drafted the text from that sheet alone, and code checked that every number in it appears on the sheet before it was published. The charts are drawn from the same figures, not written by hand.
- Medians and quartiles are used rather than the single cheapest row, because the cheapest rows in a catalogue are often category headers, package rows or a different service filed under the same name.
- The index counts distinct panels, not rows: one panel listing twenty variants of a service is one panel.