Price moves
SMM panel price moves, week to 25 October 2026
Data 19–25 October 20264 min readThe PanelCompare editorial team
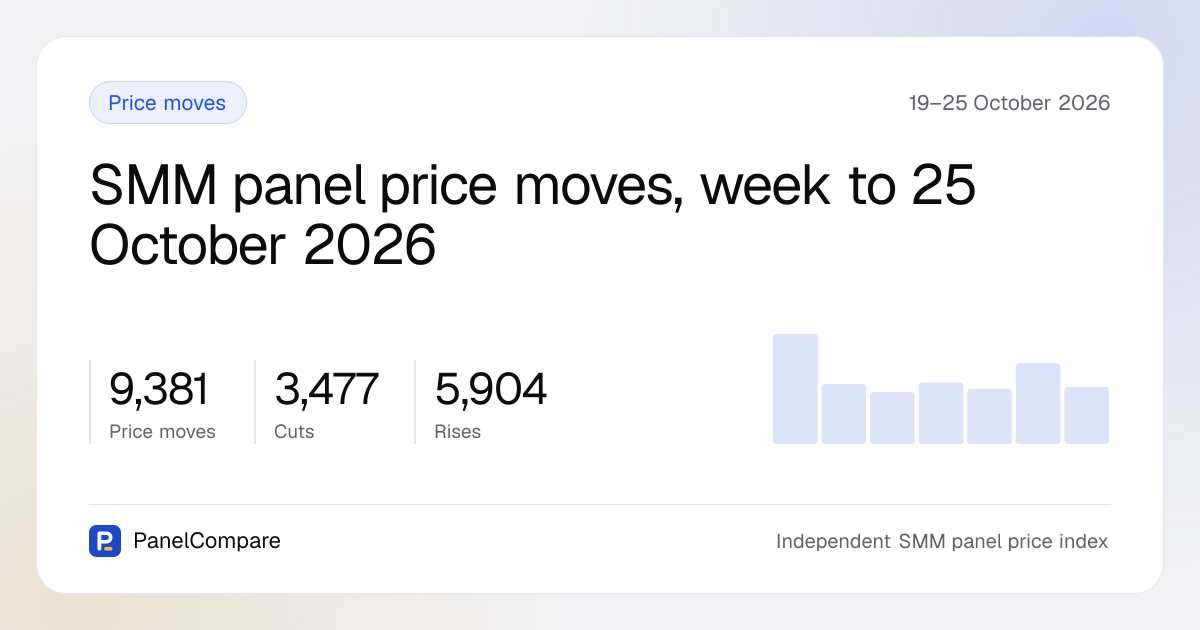
Rises outnumbered cuts this week
Between 19 and 25 October 2026, PanelCompare recorded 9,381 price moves across all tracked panels: 5,904 rises and 3,477 cuts. They came from 60 panels and touched 93 canonical services. A move is any change of 2% or more between consecutive reads of the same catalogue row, in US dollars per 1,000 units.
Rises were also larger. Among the 8,850 moves eligible for the named lists, the median rise was +30.7% and the median cut was −18.9%, and 5,095 of those moves were 20% or more in either direction.
Catalogues changed shape as well. In the same window panels added 1,230 offerings and removed 5,653. A panel's initial catalogue read counts as a baseline, not a change, and is left out of every figure here. The full log is on the changes page.
19 October 2026 was the busiest day, with 1,589 rises and 579 cuts. 23 October 2026 was the only day on which cuts outnumbered rises, with 667 cuts against 417 rises.
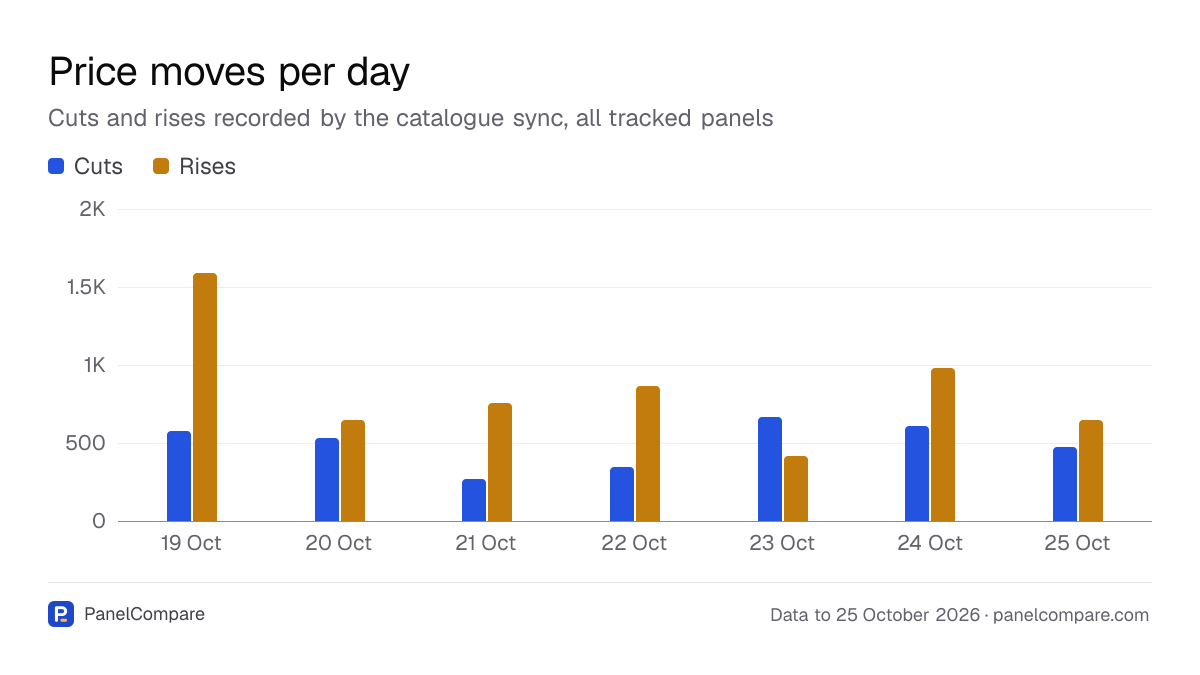
The figures in this chart
| Day | Cuts | Rises |
|---|---|---|
| 19 Oct | 579 | 1,589 |
| 20 Oct | 535 | 646 |
| 21 Oct | 269 | 755 |
| 22 Oct | 344 | 868 |
| 23 Oct | 667 | 417 |
| 24 Oct | 609 | 981 |
| 25 Oct | 474 | 648 |
The largest cuts, led by Twitch live viewers and Instagram comments
The named lists leave out moves on rows priced below $0.010 per 1,000, or larger than 1,000%. Those are counted in the totals, but they are usually a catalogue row being relabelled rather than a repricing. Each list takes at most 2 rows per panel.
The largest cut was on NotPanel's Twitch Live Viewers (1 hour), row name "Twitch Live Stream Viewers — 1 Hour", which fell from $8,261.86 to $139.16 per 1,000 on 23 October 2026, a change of −98.3%. Before ordering, compare it with every panel's price for this service.
Instagram Comments got cheaper at 2 panels. Bulk Medya cut "Instagram Comments [Random] [Max 10K] [HQ Account] [No Refill]" from $21.01 to $0.517 on 19 October 2026 (−97.5%). Sosyalbayin cut its "[ Custom - Female ] [ Power Real + Active ]" row from $21.00 to $0.517 on 20 October 2026 (−97.5%). Random and custom female comments are different products, so the matching new price does not make them interchangeable; see Instagram Comments prices.
Instagram Likes also dropped. IamProvider's "[Bot Mix] [Max 1M] [Instant] [Non Drop] [No Refill]" row went from $1.80 to $0.083 on 19 October 2026 (−95.4%), and SmmStone's "High Quality Profiles | Low Drop | 30 Days Refill" row went from $2.24 to $0.121 on 24 October 2026 (−94.6%). A bot mix with no refill and a 30-day refill row are not the same order, whatever the price; compare both on the Instagram Likes page.
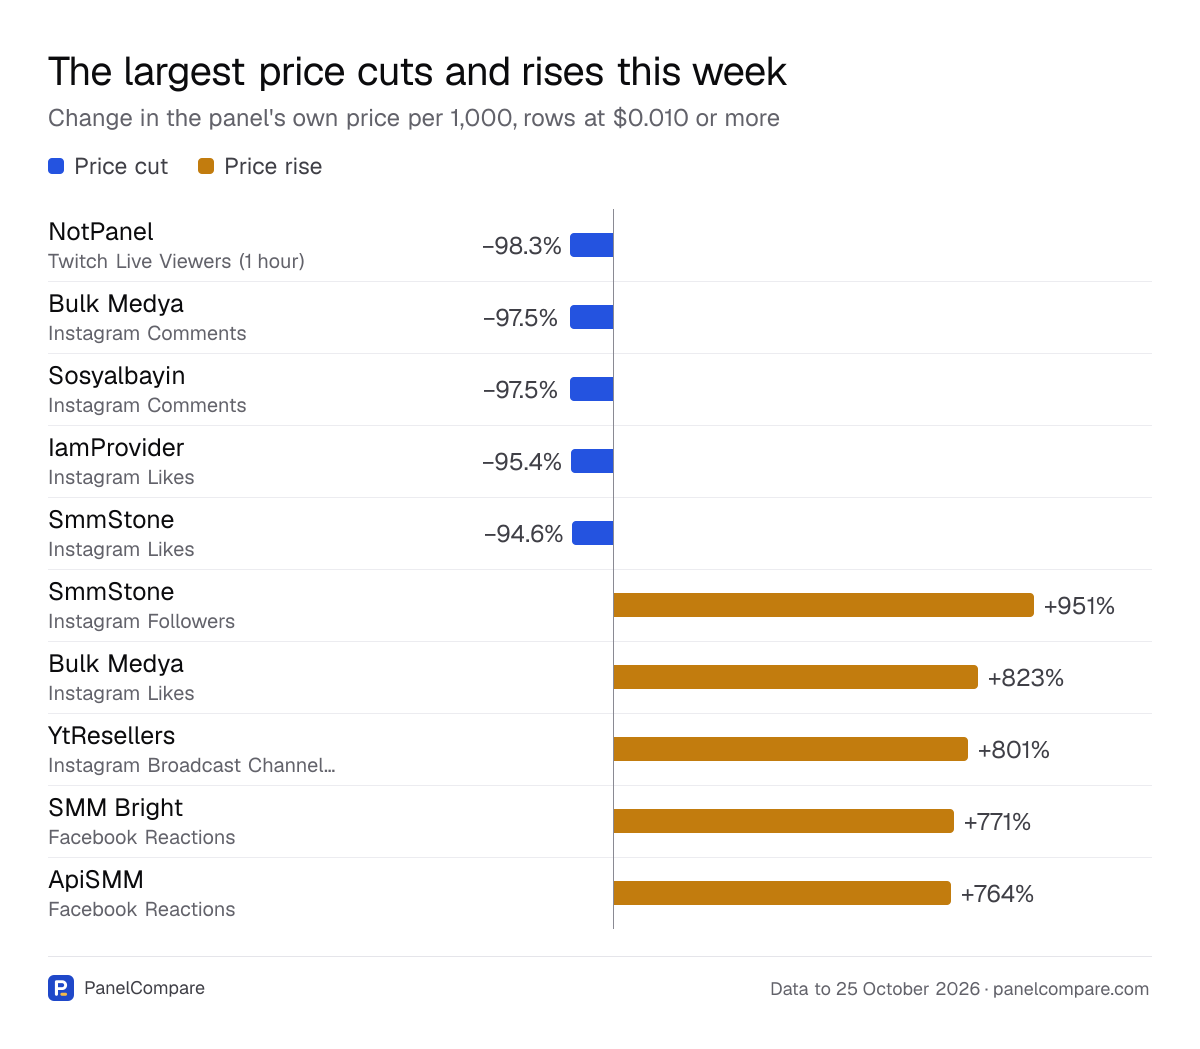
The figures in this chart
| Detail | Value | |
|---|---|---|
| NotPanel | Twitch Live Viewers (1 hour) | −98.3% |
| Bulk Medya | Instagram Comments | −97.5% |
| Sosyalbayin | Instagram Comments | −97.5% |
| IamProvider | Instagram Likes | −95.4% |
| SmmStone | Instagram Likes | −94.6% |
| SmmStone | Instagram Followers | +951% |
| Bulk Medya | Instagram Likes | +823% |
| YtResellers | Instagram Broadcast Channel Members | +801% |
| SMM Bright | Facebook Reactions | +771% |
| ApiSMM | Facebook Reactions | +764% |
The largest rises, on Instagram and Facebook rows
Anyone reselling these services should re-check their own prices. The largest rise was SmmStone's Instagram Followers, "[Global Users] [No Refill] [Super Cheap]", from $1.01 to $10.62 per 1,000 on 21 October 2026, a change of +951%. SmmStone also appears among the largest cuts, so read its full price list row by row rather than assuming a direction.
Bulk Medya raised "Instagram Likes [Real] [Max 100K] [Fast Speed] [Non Drop] [365 Days ♻️]" from $0.039 to $0.361 on 19 October 2026 (+823%), the same day it cut its comments row. The row name advertises a 365-day refill. Both moves are on the Bulk Medya price list.
YtResellers raised its Instagram Broadcast Channel Members row targeted at "🇳🇬 Nigeria 🇳🇬" with "👤 Real Profiles", from $0.609 to $5.49 on 20 October 2026 (+801%). Resellers serving Nigerian clients with this row should check other panels' prices for the service before taking the next order.
Facebook Reactions rose at 2 panels on 19 October 2026, both on no-refill rows. SMM Bright's "Facebook Post Reaction 👍 [ Refill: No Refill ❌ ]" went from $0.144 to $1.25 (+771%), and ApiSMM's "Like 👍 | Max 1M | HQ Accounts" row went from $0.088 to $0.760 (+764%). The Facebook Reactions page lists every panel's current price.
Instagram moved most, while Telegram and YouTube leaned towards cuts
Instagram moved most by a wide margin, with 3,280 rises and 1,545 cuts between 19 and 25 October 2026. TikTok followed with 722 rises and 630 cuts, then Facebook with 603 rises and 368 cuts. The Instagram changes page lists each move.
Telegram and YouTube were the only platforms among those that moved most with more cuts than rises: Telegram with 501 cuts against 407 rises, and YouTube with 206 cuts against 205 rises, close to level. See Telegram price changes for the detail.
X (Twitter) leaned heavily the other way, with 431 rises and 67 cuts. If you resell X (Twitter) services, check your margins against the X (Twitter) changes page.
How to check a move before acting on it
Every price here is read from the panels' own APIs and public price lists, in US dollars per 1,000 units. The methodology page explains how reads are taken and compared.
A large percentage on its own does not tell you whether to switch supplier or reprice. Panels list the same service under their own row names, and the row name often carries the geo target, quality tier or refill period that explains the price. Before acting on any move above:
- Open the service page and confirm the new price is still listed.
- Compare the new price with the median across panels on that page, not only with the old price.
- Read the panel's own row name for the country, quality tier and refill period, and match it to what your client ordered.
- Check the panel's recent history on the changes page before placing a large order.
How this post was made
Our code read the PanelCompare database for 19–25 October 2026 and built a fact sheet of 16 figures and 4 tables. An AI model (Claude) drafted the text from that sheet alone, and code checked that every number in it appears on the sheet before it was published. The charts are drawn from the same figures, not written by hand.
- A panel’s first catalogue read is a baseline, not a change, and is excluded from every count.
- Moves on rows below $0.010 per 1,000, or larger than 1,000%, are counted in the totals but left out of the named lists: they are usually a catalogue row being relabelled rather than a repricing.
- Panels list the same service under their own row names; the row name often carries the geo target, quality tier or refill period that explains a price.