Market rates
SMM panel median prices, week to 31 October 2026
Data 25–31 October 20264 min readThe PanelCompare editorial team
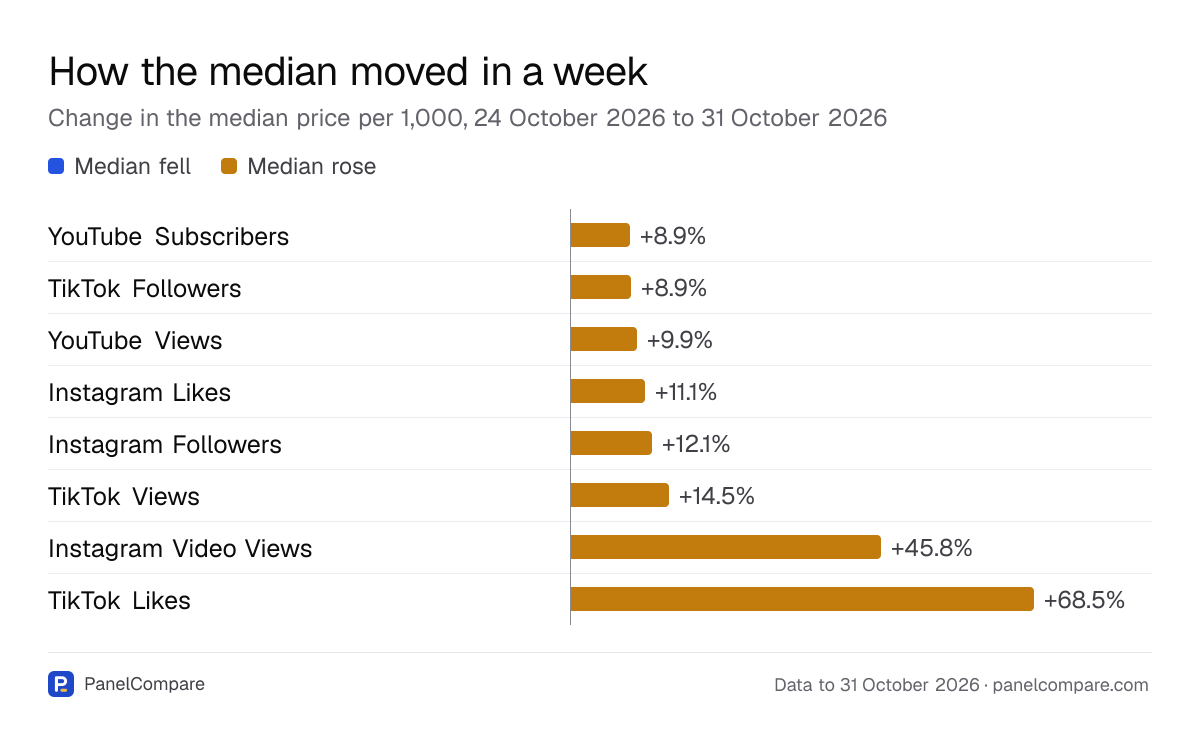
Every median rose, led by TikTok Likes and Instagram Video Views
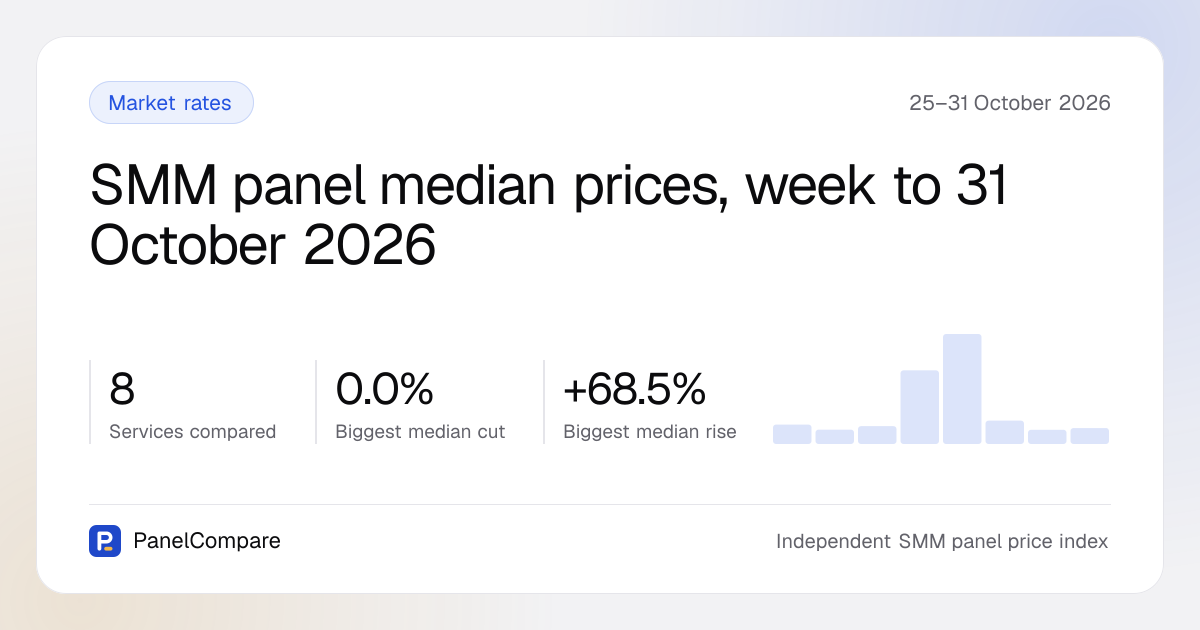
PanelCompare tracks 8 most-traded services, meaning those with high search demand and at least 10 panels in the index. For each, the median price per 1,000 on 31 October 2026 is set against the median on 24 October 2026. Every median was higher on the later day.
TikTok Likes moved most, +68.5%, from $0.373 to $0.628. Instagram Video Views came next at +45.8%, from $0.012 to $0.017. Instagram Video Views is the cheapest service in the set, so a small change in dollars shows up as a large percentage.
The other services moved within a narrower band. TikTok Views rose +14.5%, Instagram Followers +12.1%, Instagram Likes +11.1% and YouTube Views +9.9%. YouTube Subscribers and TikTok Followers had the smallest moves, both +8.9%.
The data records that the medians rose, not why they rose. The daily figures for every service are in the price index.
The figures in this chart
| Value | |
|---|---|
| YouTube Subscribers | +8.9% |
| TikTok Followers | +8.9% |
| YouTube Views | +9.9% |
| Instagram Likes | +11.1% |
| Instagram Followers | +12.1% |
| TikTok Views | +14.5% |
| Instagram Video Views | +45.8% |
| TikTok Likes | +68.5% |
Why the post uses the median and the quartiles
The cheapest row in a catalogue is a poor guide to what a service costs. It is often a category header, a package row or a different service filed under the same name. The median is the price in the middle of the offers, and those odd rows cannot drag it down.
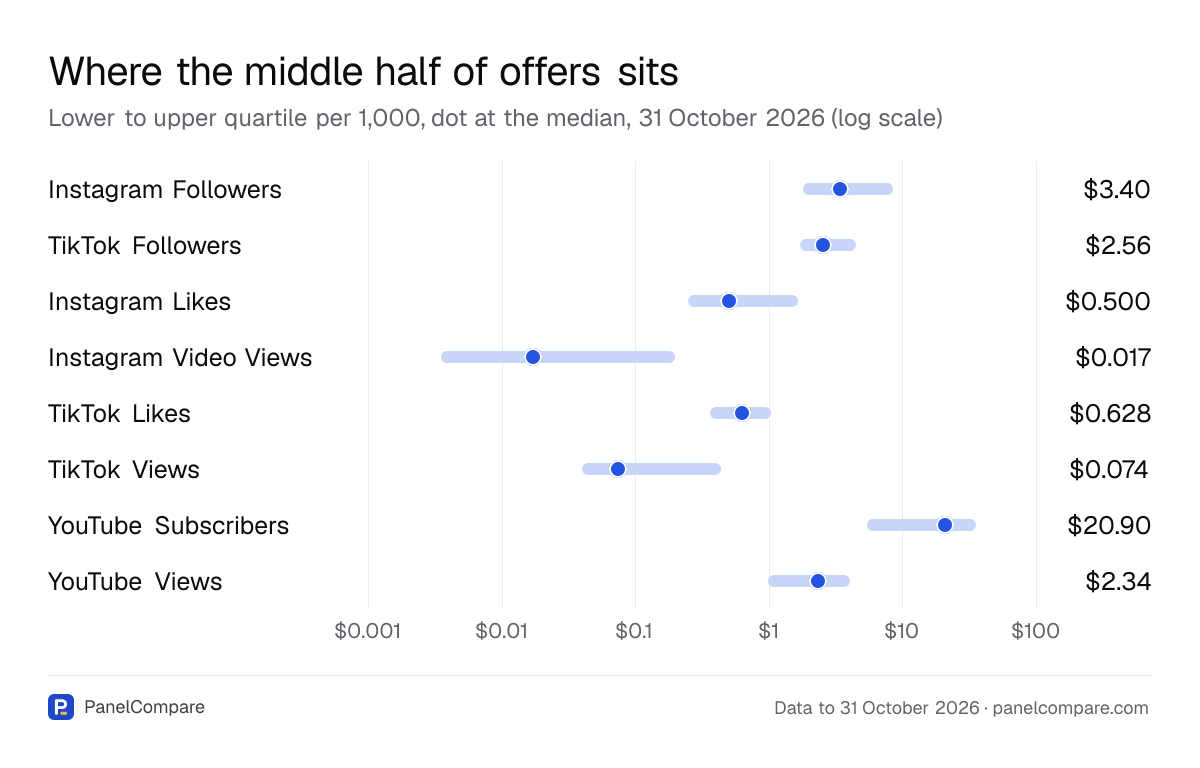
The quartiles mark the middle half of the market. The lower quartile is the price at or below which the cheapest quarter of offers sit. The upper quartile is the price above which only the dearest quarter sit.
The index counts distinct panels, not rows, so a panel listing many variants of a service counts once. On 31 October 2026 the index covered 68 panels for Instagram Followers and TikTok Followers, 67 for Instagram Likes, Instagram Video Views, TikTok Likes and TikTok Views, and 63 for each YouTube service. The methodology explains how prices are collected.
The figures in this chart
| Service | Lower quartile | Median | Upper quartile |
|---|---|---|---|
| Instagram Followers | $1.80 | $3.40 | $8.45 |
| TikTok Followers | $1.70 | $2.56 | $4.50 |
| Instagram Likes | $0.248 | $0.500 | $1.64 |
| Instagram Video Views | $0.0035 | $0.017 | $0.200 |
| TikTok Likes | $0.360 | $0.628 | $1.04 |
| TikTok Views | $0.040 | $0.074 | $0.440 |
| YouTube Subscribers | $5.42 | $20.90 | $35.63 |
| YouTube Views | $0.982 | $2.34 | $4.06 |
Instagram prices on 31 October 2026
Instagram Followers had a median of $3.40 per 1,000, with the lower quartile at $1.80 and the upper quartile at $8.45. The upper quartile sits much further above the median than the lower quartile sits below it, so the dearer half of this market is spread wide. Every panel's row is on the Instagram Followers page.
Instagram Likes had a median of $0.500, with the middle half of offers between $0.248 and $1.64. Its median was $0.450 on 24 October 2026.
Instagram Video Views had the widest spread in the set relative to its price: a median of $0.017, a lower quartile of $0.0035 and an upper quartile of $0.200. With a band that wide, the row name matters more than the headline price. The full list is on the Instagram Video Views page.
TikTok prices on 31 October 2026
TikTok Followers had a median of $2.56 per 1,000, between a lower quartile of $1.70 and an upper quartile of $4.50. That is a tighter band than Instagram Followers, with the median close to the middle of it.
TikTok Likes had a median of $0.628, with quartiles at $0.360 and $1.04. This is the median that moved most during the week, so the TikTok Likes page is worth checking before you set your own price.
TikTok Views had a median of $0.074, a lower quartile of $0.040 and an upper quartile of $0.440. As with Instagram Followers, the upper quartile sits well above the median, so dearer offers vary widely.
YouTube prices on 31 October 2026
YouTube Subscribers is the most expensive service in the set. Its median was $20.90 per 1,000, with the lower quartile at $5.42 and the upper quartile at $35.63, a wide band in dollar terms. Its median was $19.20 on 24 October 2026. Every offer is on the YouTube Subscribers page.
YouTube Views had a median of $2.34, with the middle half of offers between $0.982 and $4.06. Its median was $2.13 on 24 October 2026.
Using the quartiles to check a price
The quartiles give a quick test for any offer on these 8 services, whether you are buying from a panel or setting your own resale price. Compare the price with the figures above before you look at anything else.
A short routine:
- Below the lower quartile: read the full row name before ordering. A low price can belong to a package row, a different service filed under the same name, or a quality tier the name spells out.
- Between the quartiles: the price sits where the middle half of offers sat on 31 October 2026.
- Above the upper quartile: check whether the row name states something extra, such as a country target, a refill period or a delivery speed. If it states nothing, you may be overpaying.
- Recheck weekly: every median here moved between 24 October 2026 and 31 October 2026, so older figures may already be out of date.
How this post was made
Our code read the PanelCompare database for 25–31 October 2026 and built a fact sheet of 56 figures and 1 tables. An AI model (Claude) drafted the text from that sheet alone, and code checked that every number in it appears on the sheet before it was published. The charts are drawn from the same figures, not written by hand.
- Medians and quartiles are used rather than the single cheapest row, because the cheapest rows in a catalogue are often category headers, package rows or a different service filed under the same name.
- The index counts distinct panels, not rows: one panel listing twenty variants of a service is one panel.