Price moves
SMM panel price moves, week to 30 October 2026
Data 24–30 October 20264 min readThe PanelCompare editorial team
Rises outnumbered cuts this week
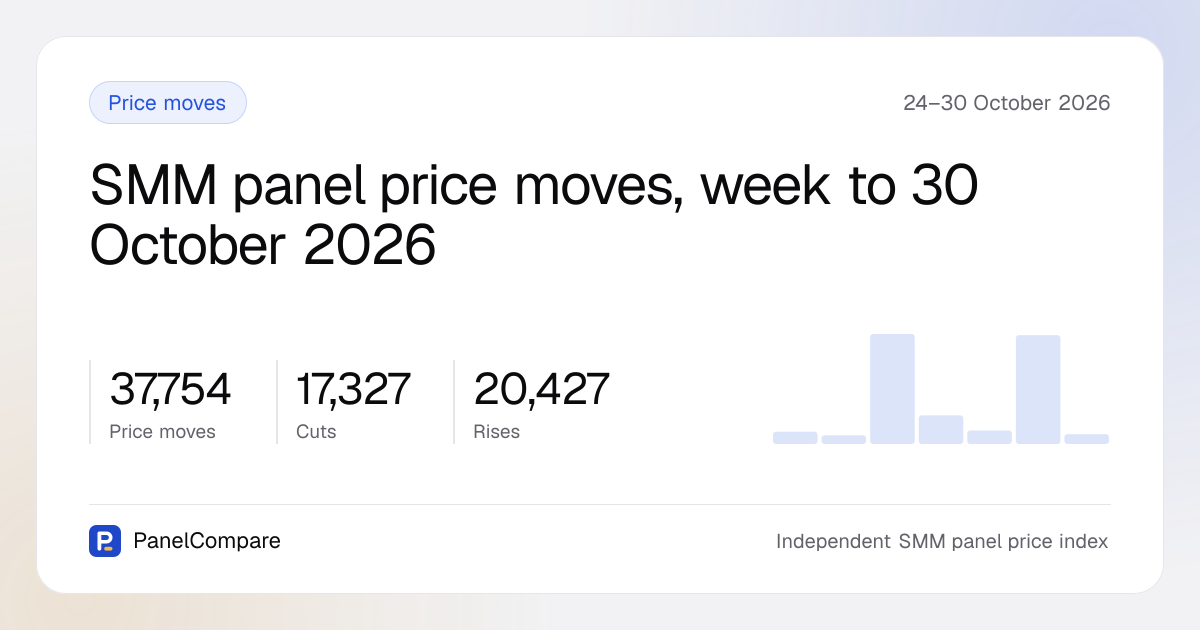
PanelCompare recorded 37,754 price moves across all tracked panels between 24 and 30 October 2026: 20,427 rises and 17,327 cuts. They came from 64 panels and touched 142 canonical services. Every price here is the panel's own price in US dollars per 1,000 units.
A move is recorded when the same catalogue row changes by 2% or more between reads. A panel's first catalogue read is a baseline and is excluded from every count. In the same window panels added 24,020 offerings to their catalogues and removed 6,282, all logged on the changes page.
The moves were not spread evenly. On 26 October 2026 the sync recorded 12,896 cuts, and on 29 October 2026 it recorded 13,361 rises; no other day came close on either count. The data does not show why, so check the date of any move you plan to act on.
Of the 36,756 moves eligible for the named lists below, 16,728 were 20% or more in either direction. The median rise was +53.8% and the median cut was −9.1%, so rises tended to be bigger steps than cuts.
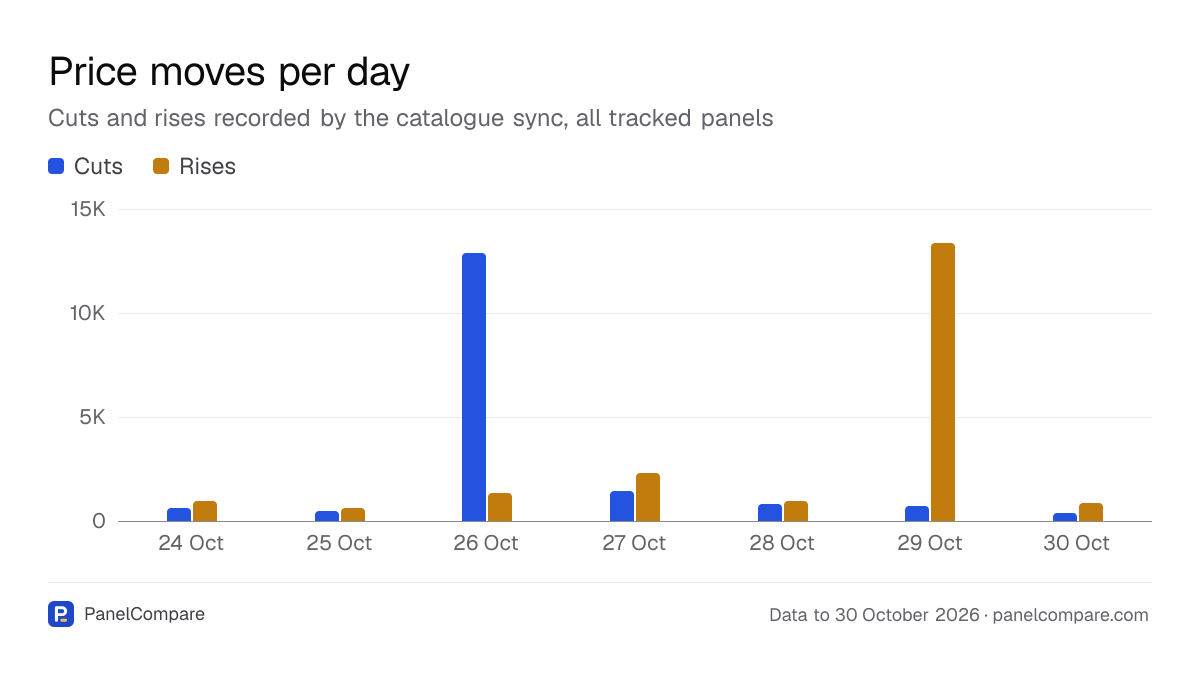
The figures in this chart
| Day | Cuts | Rises |
|---|---|---|
| 24 Oct | 609 | 981 |
| 25 Oct | 474 | 648 |
| 26 Oct | 12,896 | 1,337 |
| 27 Oct | 1,423 | 2,285 |
| 28 Oct | 806 | 943 |
| 29 Oct | 720 | 13,361 |
| 30 Oct | 399 | 872 |
The largest cuts were on YouTube Likes and Subscribers
The deepest cut was SocNet SMM's YouTube Likes, from $1.80 to $0.030 per 1,000 (−98.3%) on 30 October 2026. The panel's own row name includes "No Warranty ⚠️", which is the condition attached to that price. The row sits in the SocNet SMM price list.
YouTube Subscribers took the next places. SMMGlide went from $0.966 to $0.025 (−97.4%) on 27 October 2026, on a row labelled "MQ 1M". SMMWiz went from $0.601 to $0.020 (−96.7%) on 26 October 2026, row name "[ NO REFILL ]", and SMMLite from $0.551 to $0.020 (−96.4%) on 27 October 2026, row name "ULTRAFAST, NO REFILL". Compare them on the YouTube Subscribers page.
SocNet SMM also cut a YouTube Subscribers row from $0.270 to $0.010 (−96.3%) on 30 October 2026. Its own row name, though, begins "Youtube Likes" and includes "LQ Profiles | High Drop", so the label and the service do not match. Read that row carefully before you treat it as a subscriber price.
Several of these cheap rows state no refill or no warranty in their own names. The lower price comes with that condition written on it.
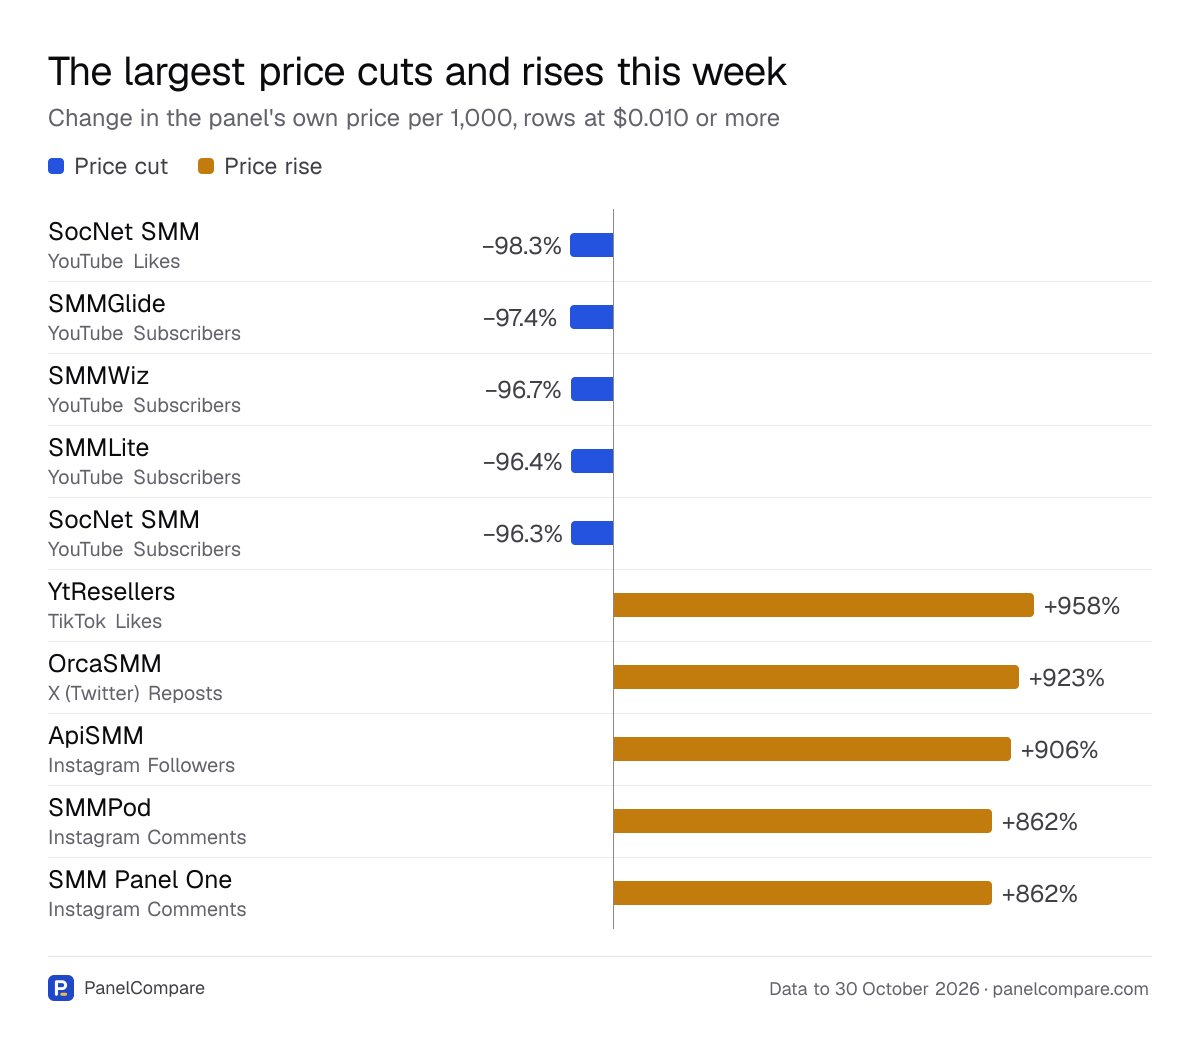
The figures in this chart
| Detail | Value | |
|---|---|---|
| SocNet SMM | YouTube Likes | −98.3% |
| SMMGlide | YouTube Subscribers | −97.4% |
| SMMWiz | YouTube Subscribers | −96.7% |
| SMMLite | YouTube Subscribers | −96.4% |
| SocNet SMM | YouTube Subscribers | −96.3% |
| YtResellers | TikTok Likes | +958% |
| OrcaSMM | X (Twitter) Reposts | +923% |
| ApiSMM | Instagram Followers | +906% |
| SMMPod | Instagram Comments | +862% |
| SMM Panel One | Instagram Comments | +862% |
The largest rises hit TikTok Likes, reposts and Instagram
YtResellers raised a TikTok Likes row from $0.049 to $0.523 per 1,000 (+958%) on 26 October 2026. The row name reads "HQ Accounts" and "No Refill ⚠️". Anyone reselling it should check the YtResellers price list.
OrcaSMM raised X (Twitter) Reposts from $0.763 to $7.80 (+923%) on 26 October 2026, on a row named "Twitter Real Retweets" with "30 Days Refill". Other panels' prices for the service are on the X (Twitter) Reposts page.
ApiSMM raised an Instagram Followers row from $0.936 to $9.41 (+906%) on 29 October 2026. The row name specifies "[ Turkey ] [ Old Accounts ] | 30 Days Refill", so this is a Türkiye-targeted offering, not a general follower price. See the Instagram Followers page for the rest of the market.
Instagram Comments rose +862% at 2 panels on 30 October 2026. SMMPod went from $0.520 to $5.00 on "Instagram Custom Comments" with "Refill: 30 Days", and SMM Panel One from $0.624 to $6.00 on a "[ CUSTOM ]" row with "Real Worldwide MIX". Both are on the Instagram Comments page.
TikTok leaned to rises, Instagram and Telegram to cuts
Among the platforms that moved most, TikTok had 5,176 rises against 1,987 cuts, and Website Traffic had 2,640 rises against 1,319 cuts. If you resell TikTok services, the TikTok changes page lists every move.
Instagram went the other way, with 4,179 cuts and 3,189 rises. Telegram also had more cuts than rises: 3,471 against 2,785. The detail is on the Instagram changes page.
YouTube had 1,951 rises and 1,713 cuts, and Facebook was almost evenly split at 1,499 rises and 1,490 cuts. So the deep YouTube cuts above are individual rows, not a sign that YouTube got cheaper overall: rises outnumbered cuts there this week, as the YouTube changes page shows.
How to check a move before acting on it
The named lists leave out moves on rows below $0.010 per 1,000 and moves larger than 1,000%. Those are still counted in the totals, but they are usually a catalogue row being relabelled rather than a repricing. The rules are set out in the methodology.
Before you change your own price or place an order on the back of a move, run through these steps:
- Open the service page and find the panel's row, so the new price sits beside every other panel's.
- Compare the new price with the service's median; a price far from it is the one to question.
- Read the panel's own row name for the geo target, quality tier or refill period.
- Check the date the move was recorded and look at the panel's full price list for related rows.
How this post was made
Our code read the PanelCompare database for 24–30 October 2026 and built a fact sheet of 16 figures and 4 tables. An AI model (Claude) drafted the text from that sheet alone, and code checked that every number in it appears on the sheet before it was published. The charts are drawn from the same figures, not written by hand.
- A panel’s first catalogue read is a baseline, not a change, and is excluded from every count.
- Moves on rows below $0.010 per 1,000, or larger than 1,000%, are counted in the totals but left out of the named lists: they are usually a catalogue row being relabelled rather than a repricing.
- Panels list the same service under their own row names; the row name often carries the geo target, quality tier or refill period that explains a price.